Back to case studies

Innovatr

Rebuilt the whole front of a research business — positioning, website, content engine and paid programme — sourced its addressable market from nothing, and replaced a US$8,000-a-year software licence with a product the company could sell.

Client · Innovatr · Brand & Marketing Manager · Mar – Sep 2026

  • Rebranding
  • Content
  • Paid media
  • Lead sourcing
  • Marketing automation
  • Product build

Innovatr is a consumer research and growth consultancy. I joined as Brand & Marketing Manager and rebuilt the front of the business: the positioning, the website, the content engine that turns research into demand, and the paid programme underneath it. I also built the social listening product the business now sells.

The starting point

Innovatr sold fast, affordable consumer research into a market that had been buying the same thing from Kantar, IPSOS and Nielsen for decades. The product was genuinely different. The way it was presented was not.

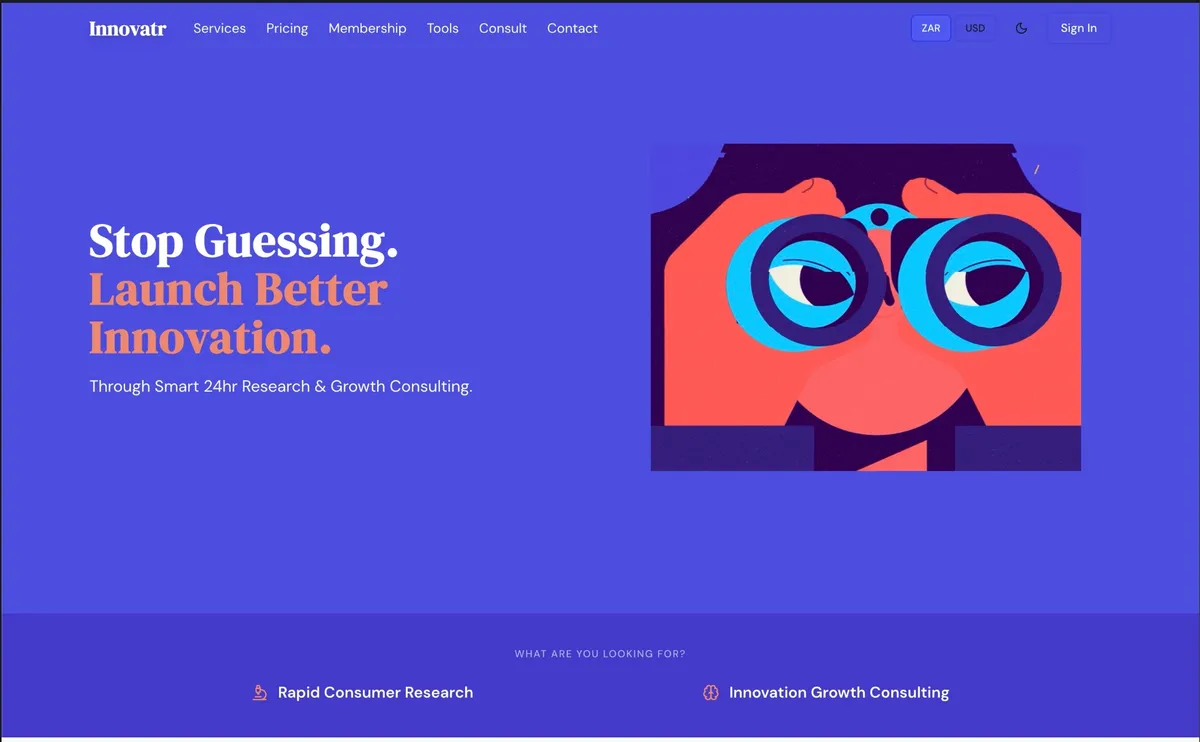
The site led with “Stop Guessing. Launch Better Innovation.”, a line that could have belonged to any research agency. There was no paid programme, effectively no inbound traffic, and no repeatable way of turning the research the company was already producing into demand for the research it wanted to sell.

Brand and website

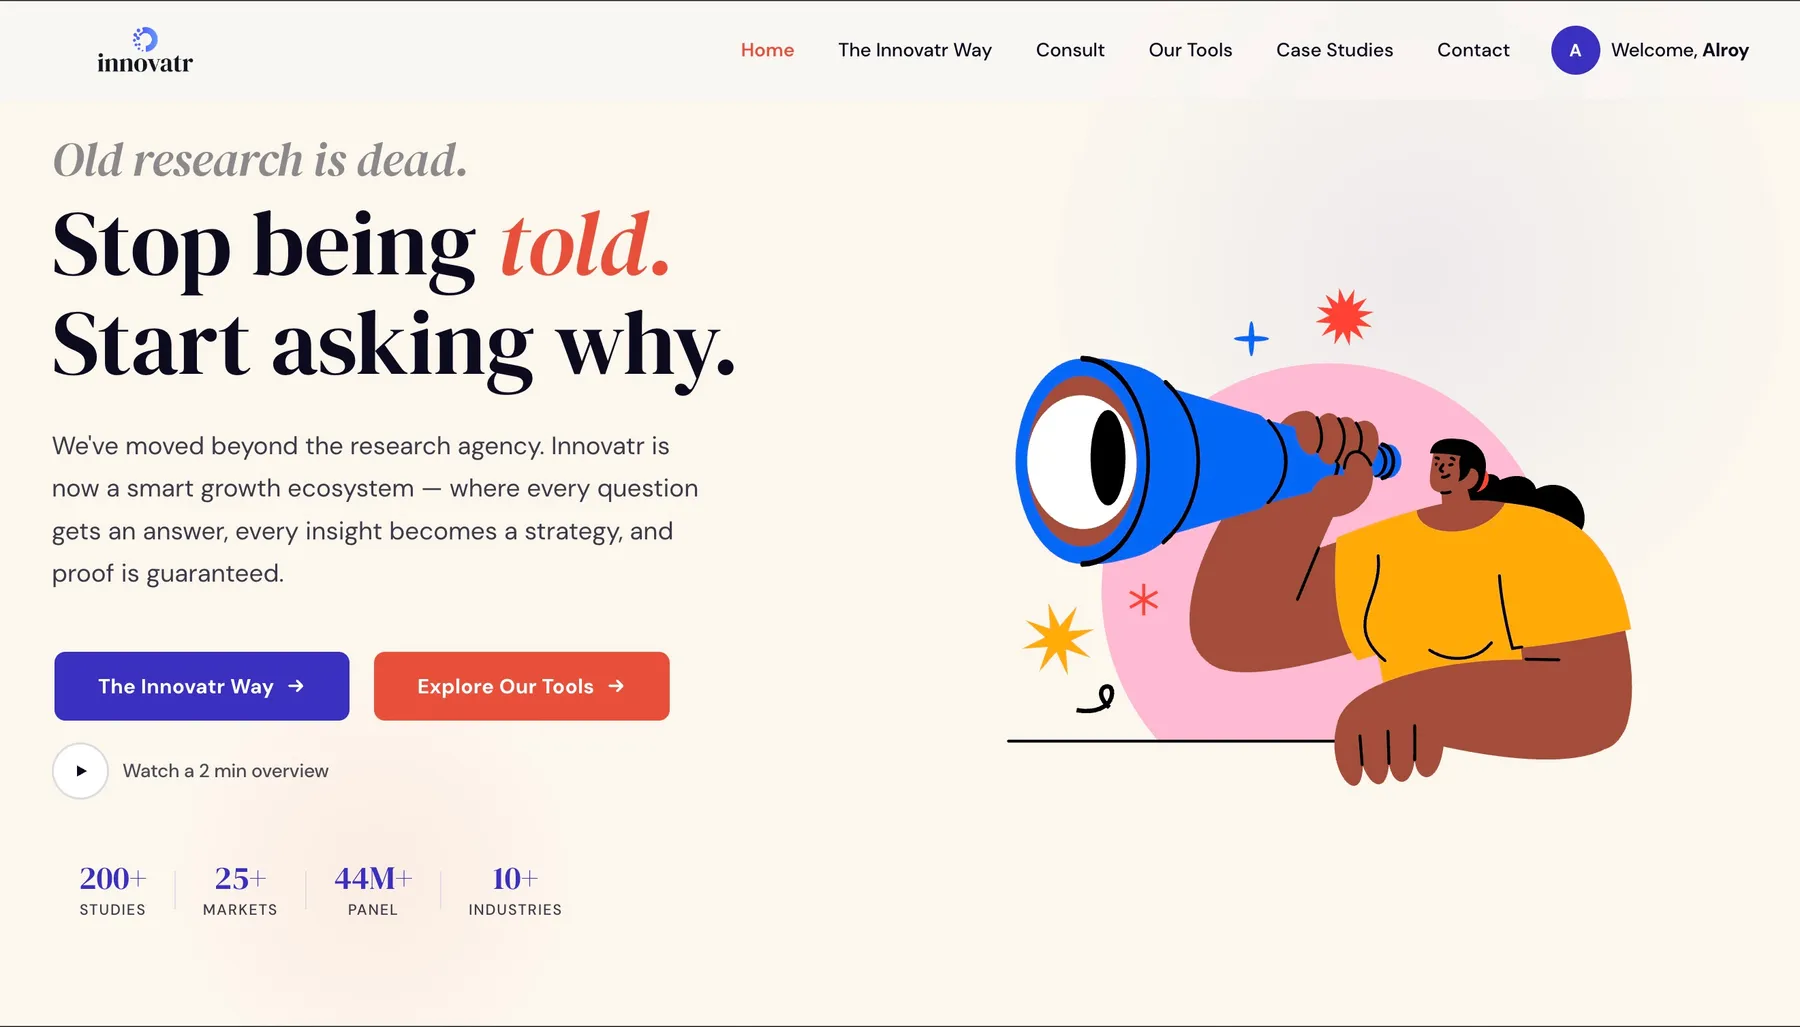
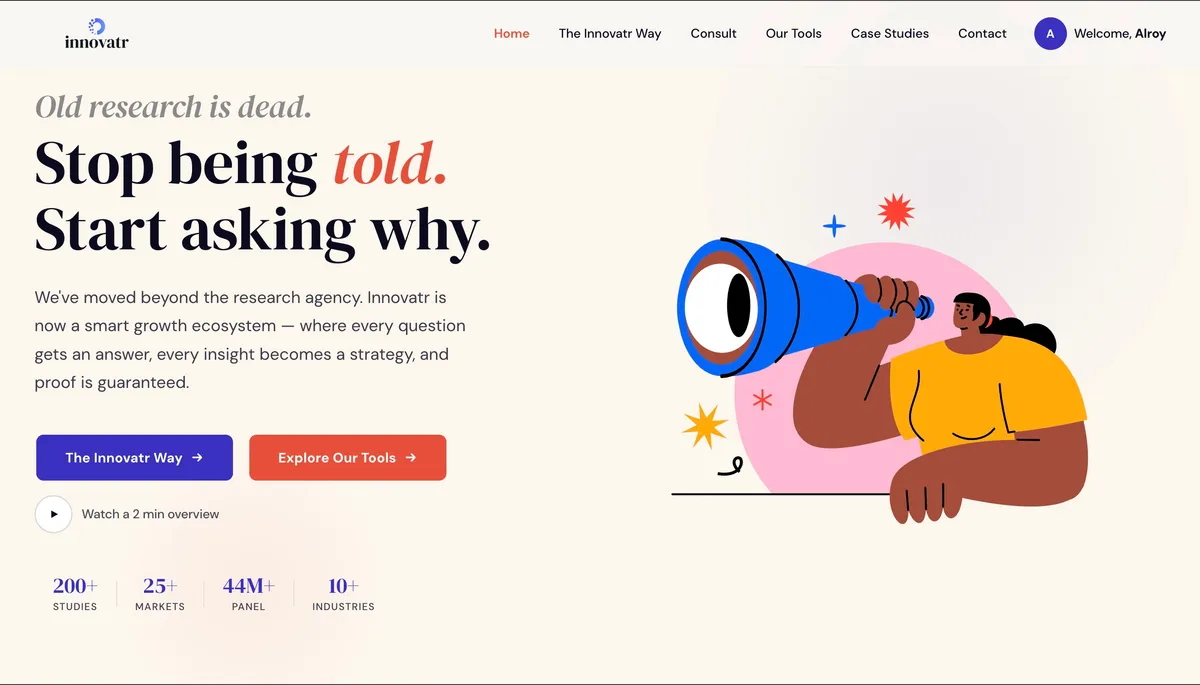
The repositioning turned a generic promise into an argument. “Old research is dead. Stop being told. Start asking why.” gives the reader something to disagree with, and the proof sits directly underneath it: 200+ studies, 25+ markets, a 44M panel.

Before
After
Home The Innovatr home page before and after: a generic purple “Stop Guessing” hero replaced by an editorial layout headlined “Old research is dead. Stop being told. Start asking why.” with proof stats beneath it.
Before
After
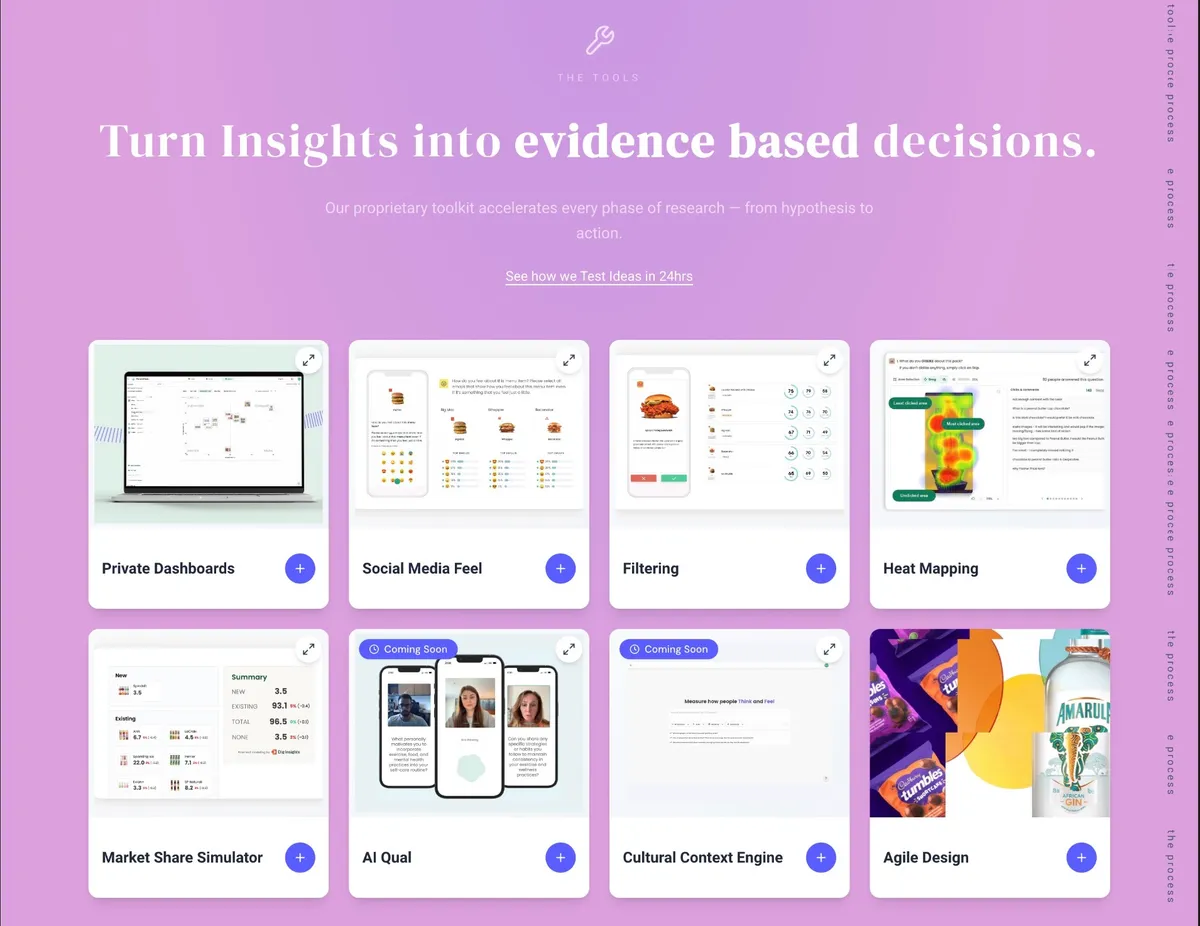
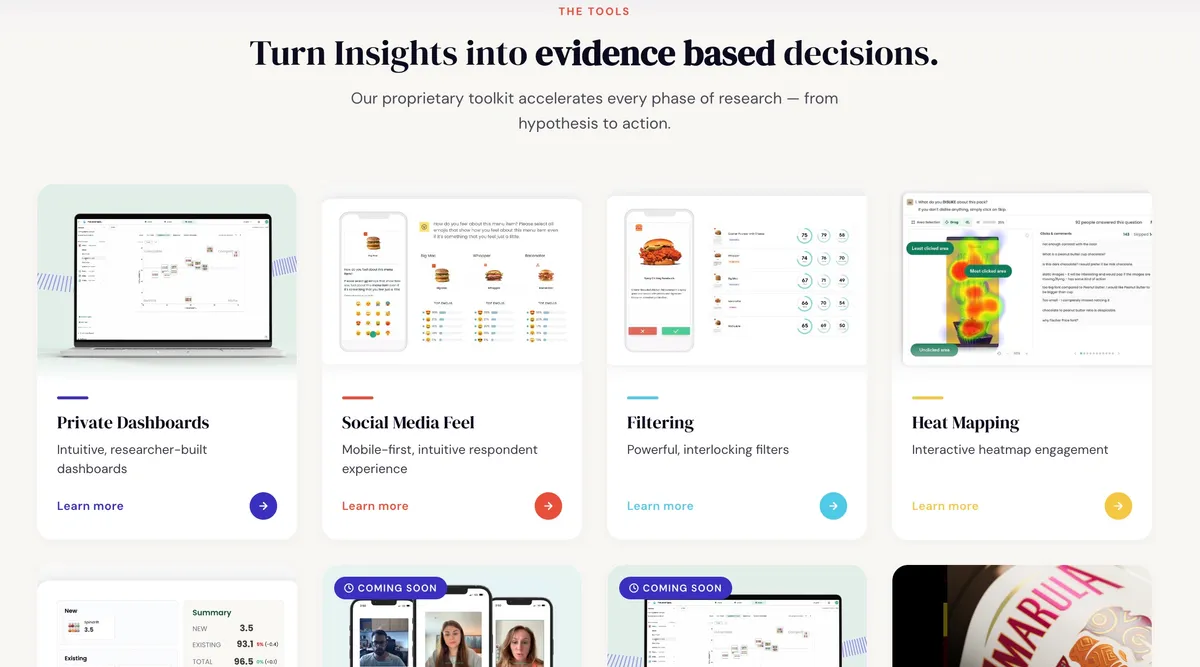
Tools The tools section before and after: a dense pink grid of cards rebuilt as a lighter, clearly ranked set with descriptions and states.
Before
After
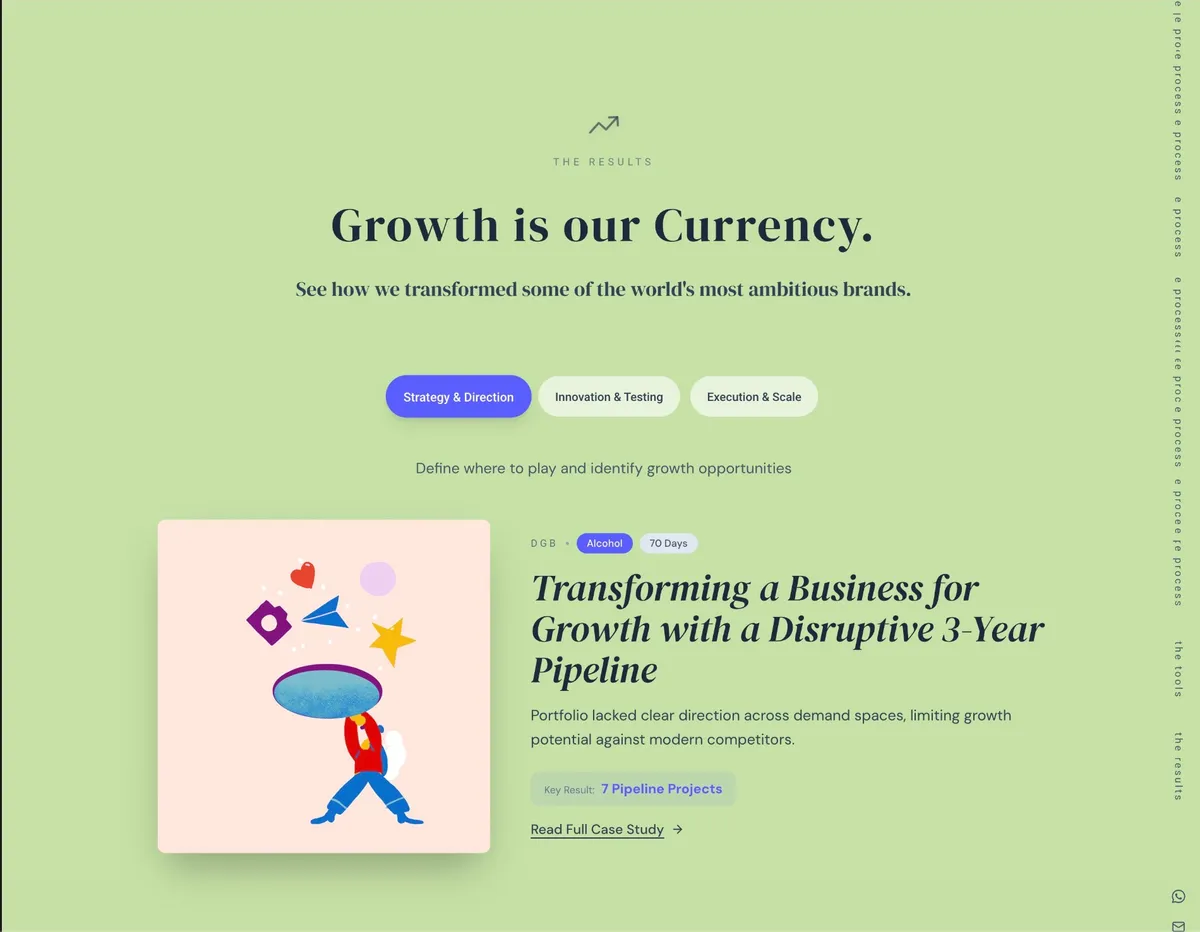
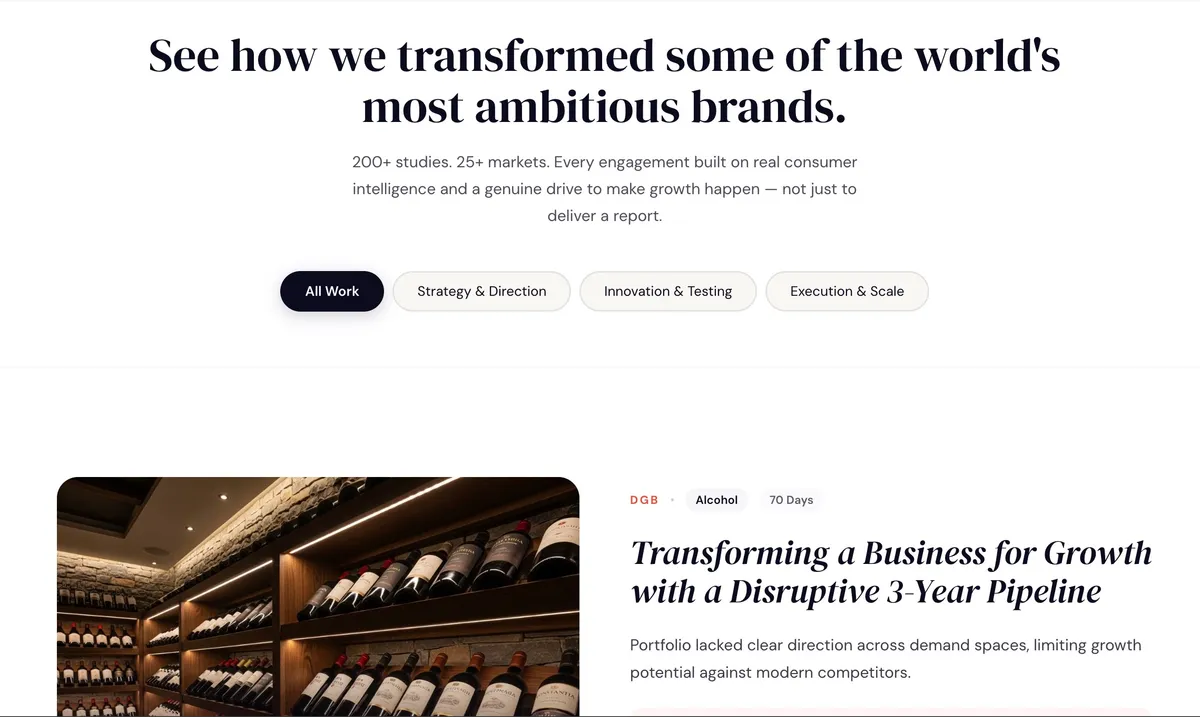
Case studies The case study section before and after the rebuild.
Before
After
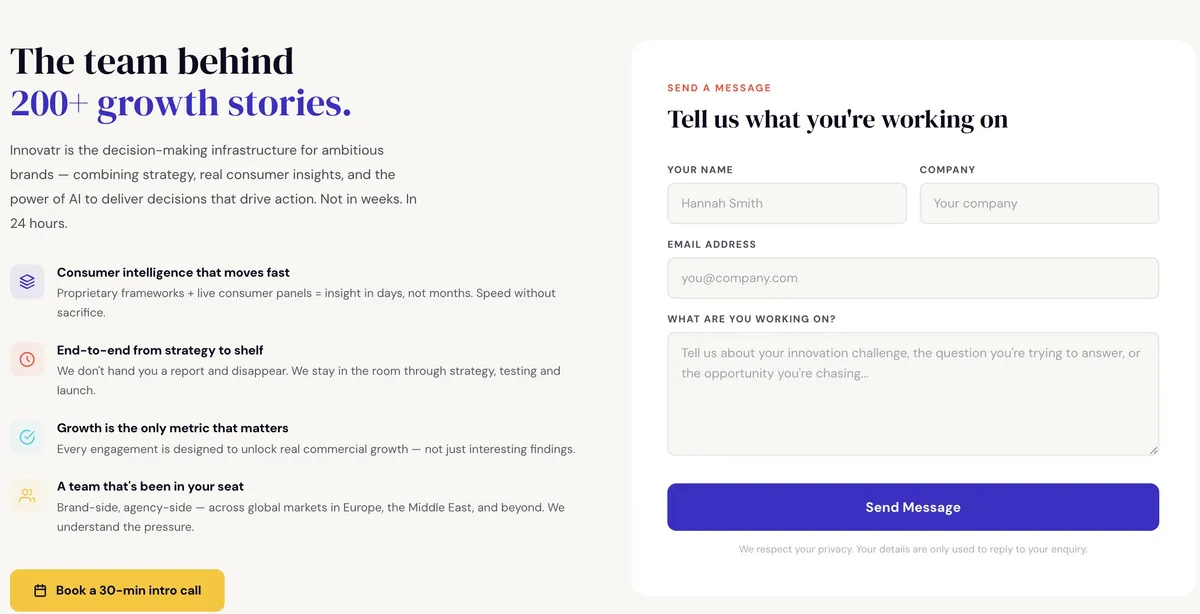
Contact The contact page before and after the rebuild.

Turning research into content

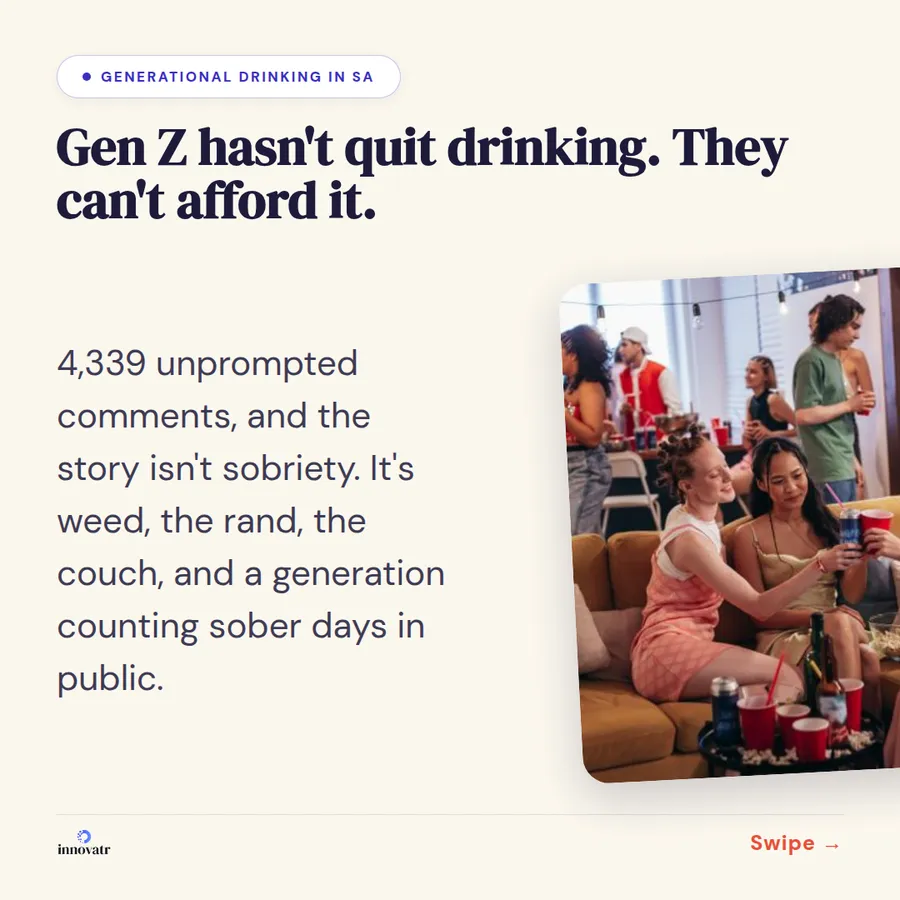
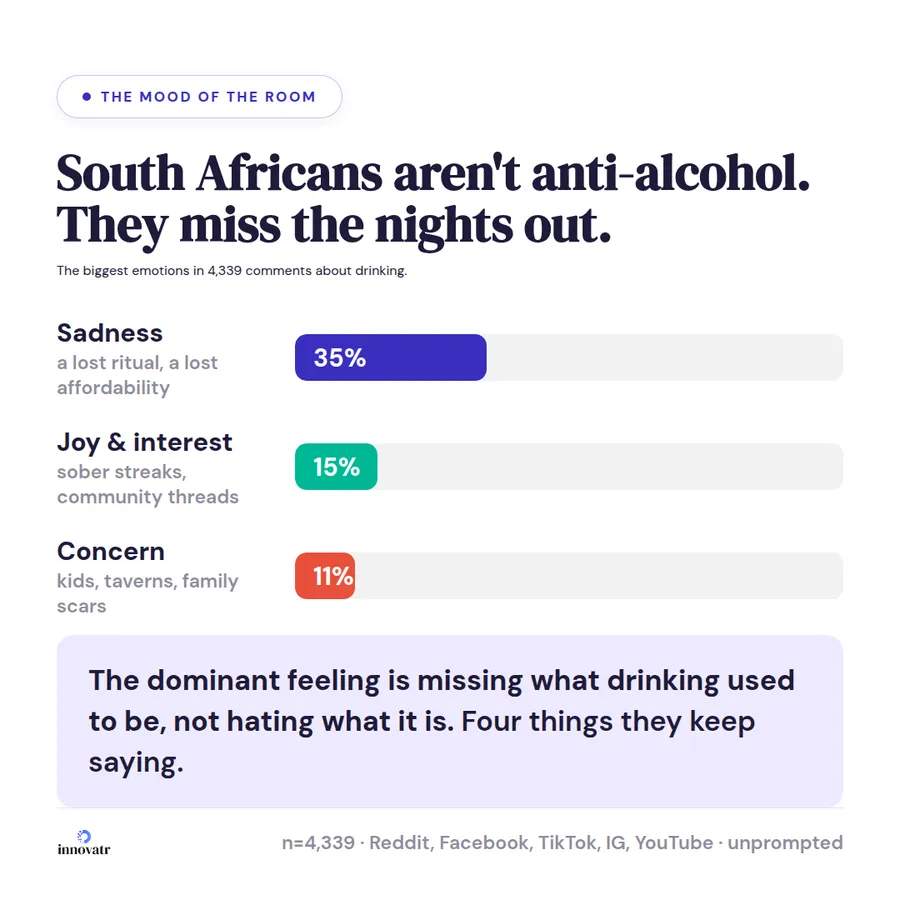
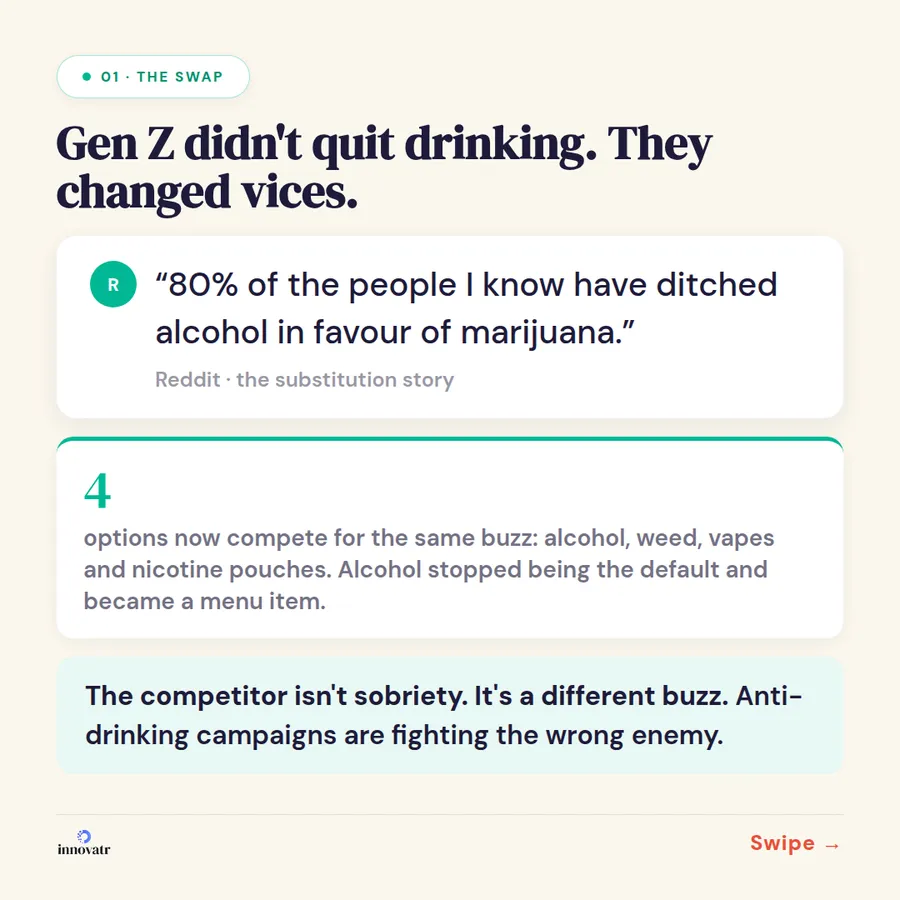
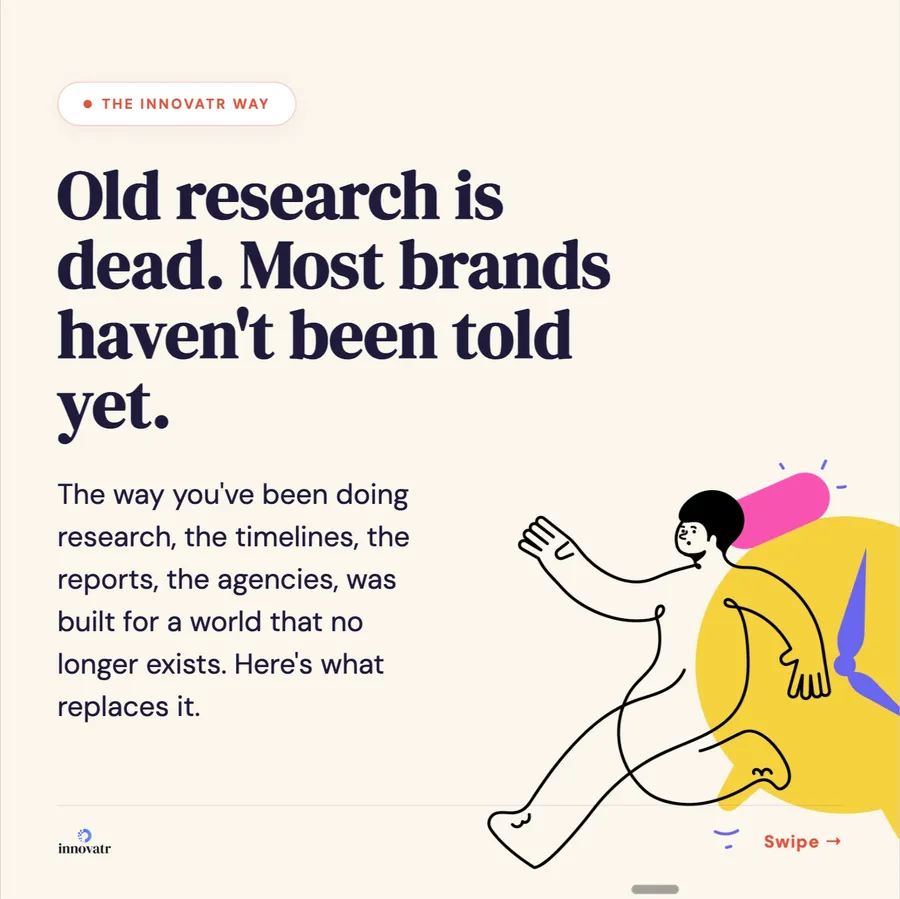
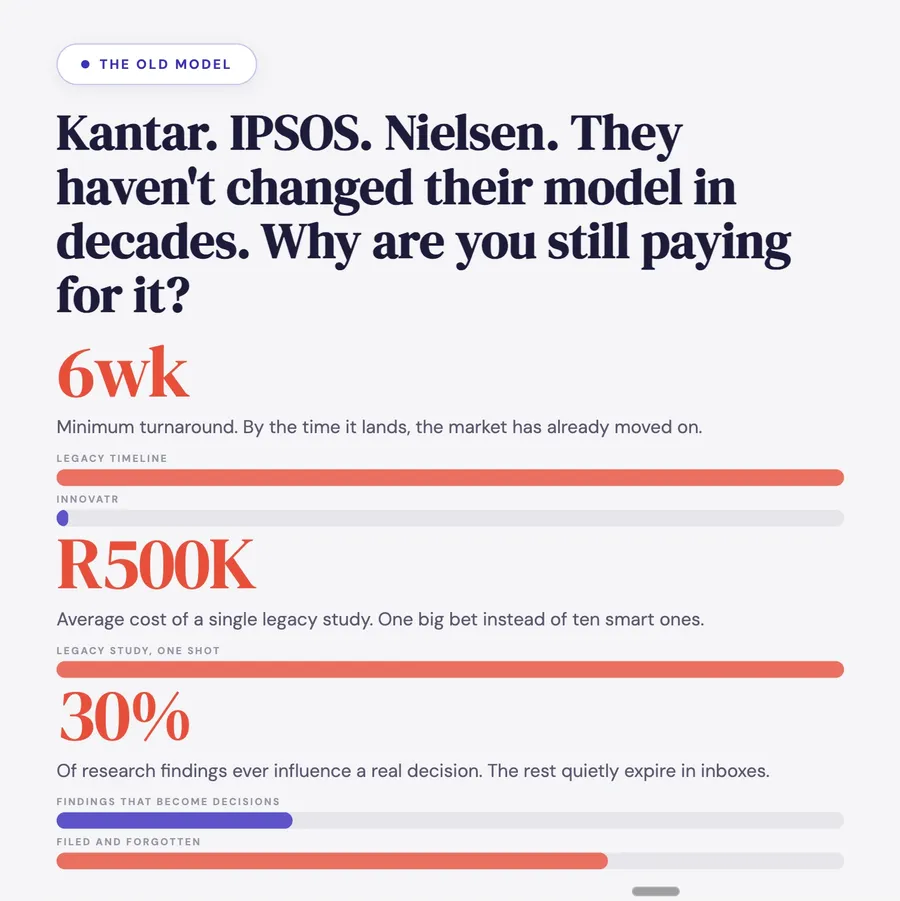
Innovatr was sitting on the raw material for its own marketing: every study it ran produced findings nobody outside the client ever saw. Two different jobs came out of that. The Gen Z drinking carousel is a report — the actual research, argued in public, with the 4,339 comments behind it shown rather than described. The old-versus-new research carousel is the social content built around the method, making the case for why any of it should be believed. Both do the same thing the product does: state a claim, then put the evidence directly underneath it.

Ad creative

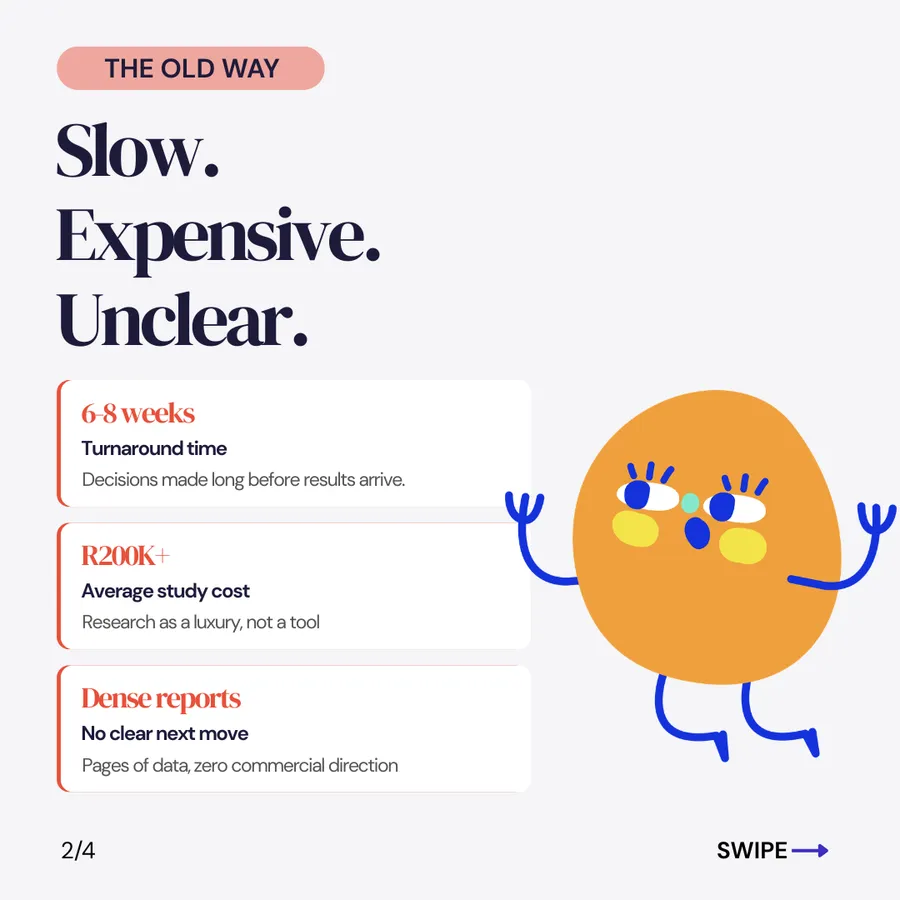
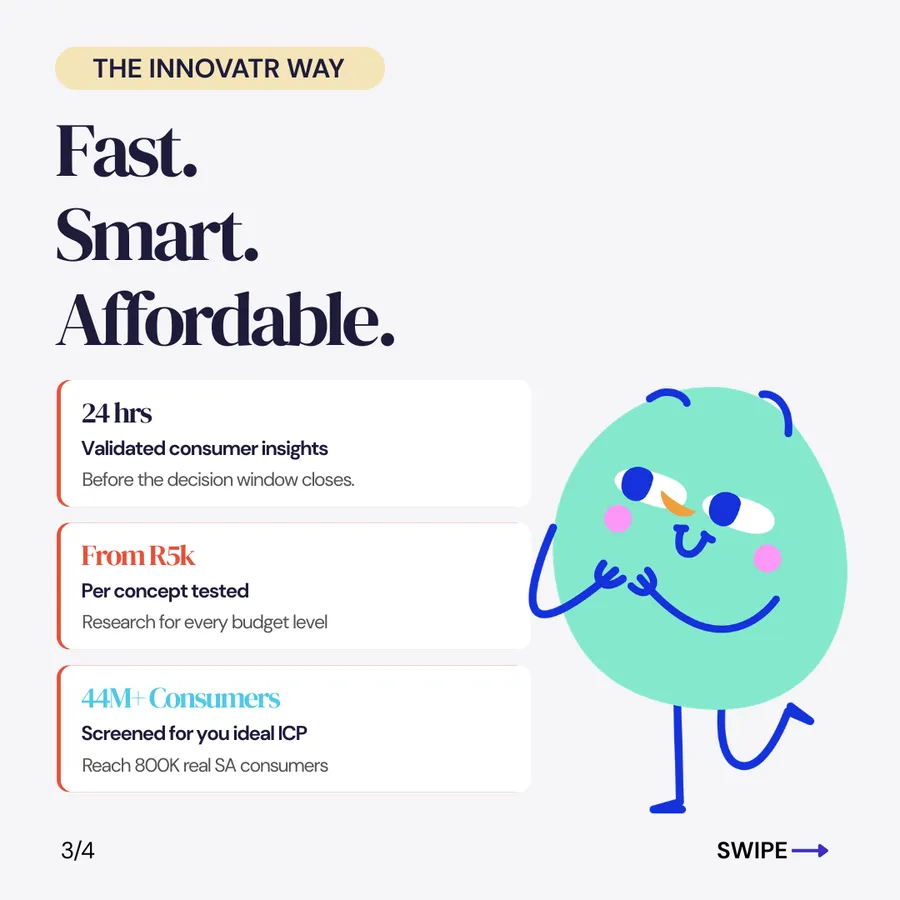
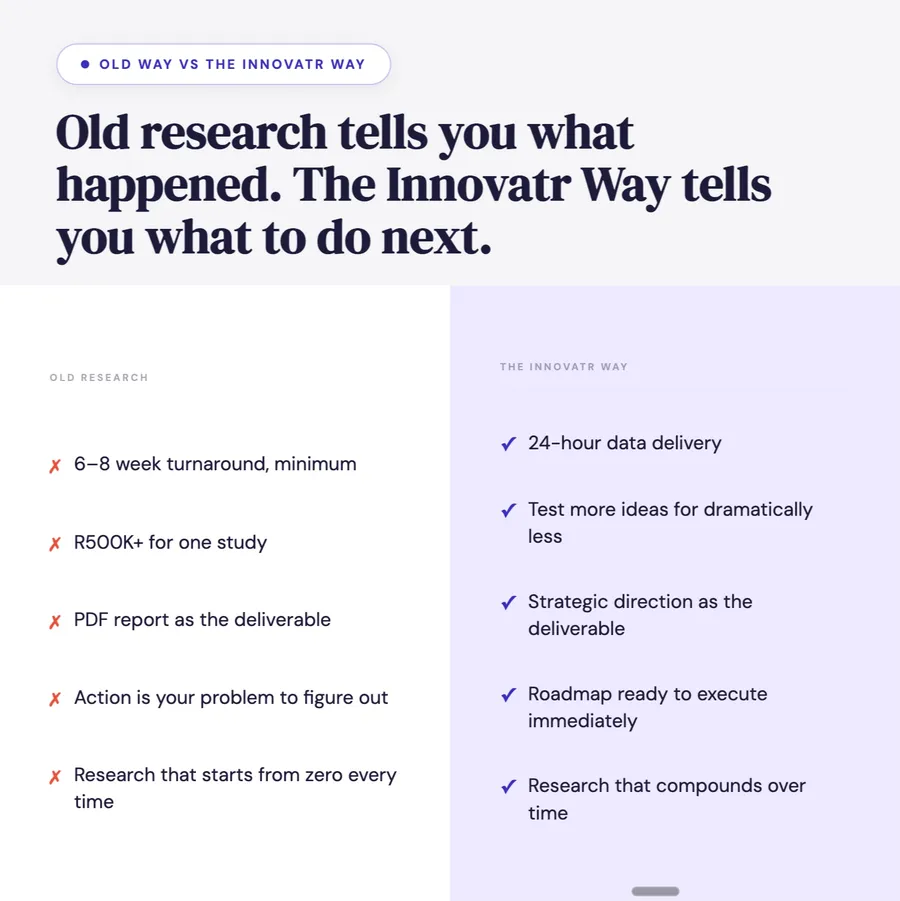
The paid programme ran the same argument in a format built to be scrolled past. “The Innovatr Way” set the competitive frame directly: Kantar, IPSOS and Nielsen have not changed their model in decades, six week turnarounds, R500K studies, and 30% of findings ever influencing a decision.

Building the pipeline

A business selling research to decision-makers has to know exactly who those decision-makers are, and Innovatr had no list at all. So I built one — Apollo ICP prospecting, the shared Workshop17 tenant database, direct client outreach, the LinkedIn page audience and inbound signups — de-duplicated it by email into one CRM, and then matched it back into LinkedIn as the audiences the paid programme ran against. That last step is the point of the whole exercise: the ads were aimed at named companies and real job titles instead of the platform's guesses about interests, and the delivery numbers below are what that bought.

3,094
Unique contacts in the CRMDe-duplicated by email across every source, so nobody is counted twice. Built from zero in six months.
1,272
Organisations mappedThe addressable market as a list of companies — which is what account-based targeting needs to exist.

Sourced audience, not inbound enquiries — a distinction plenty of reporting skips. The proof this worked is under Results: LinkedIn's own delivery demographics show the ads landing on the seniorities and companies these lists were built from.

The ads landed in the right rooms

Spending on ads is easy; the business question is whether they reached people who can actually buy. Innovatr sells research to senior decision-makers at banks, insurers and consumer brands, so the first test of the paid programme is not clicks — it is LinkedIn's own delivery demographics.

61%
Of delivery reached decision-makersSenior 35%, Director 14%, VP 4%, C-suite 3%, Owner 4%, Partner 1%. Entry-level profiles: under 3%.
14 of 22
Top companies by delivery were targetsAbsa, FNB, Standard Bank, Nedbank, Capitec, Discovery, Investec, Old Mutual and Santam among them — the exact institutions the research sells to. PwC, EY and Deloitte fill most of the rest.
16.9%
Of delivery into banking & financeThe best-covered target vertical: top five in every single ad set, and it completed videos at 2–4× the average rate.
56%
In the three target metrosJohannesburg 38%, Pretoria 10%, Durban 8% — the geography Innovatr sells into.

All from LinkedIn's delivery demographics for the account, April–July 2026. This is the part of paid media spend cannot fake, and it is what made a small budget worth anything: nearly two-thirds of every rand landed on someone senior enough to sign off a study.

Leads grew, and got better every month

Inbound lead-form leads by month — count and quality together, because the count alone says nothing. The programme ran in short creative flights, and each flight tightened who the forms were put in front of.

Inbound leads by month
MonthInbound leadsWhat changed
Apr 202610Broad launch flight. Forms captured personal emails — only ~27% corporate.
May 202612Creative eras tested head to head; forms rebuilt to require work email and phone.
Jun 20262Between flights — that month's ads pointed at traffic and video, not lead forms.
Jul 202628Refined vertical flight: 91% work emails, and 9 of the newest 11 squarely in the ICP.

Work-email share climbed from ~27% at launch to ~75% mid-programme to 91% in the newest cohort — the audience refinement showing up in the pipeline itself. Leads are deliberately not set against the total media budget: that budget was buying four different jobs at once, which the next section separates.

One budget, four jobs — each judged on its own

Judging the whole media budget on leads would be wrong, because most of it was never pointed at leads. The spend split across four formats with four different jobs: video bought attention, carousels bought site conversions, static bought cheap clicks, and only the lead-gen documents bought leads. So each format is scored on the job it was given, against LinkedIn's own B2B benchmarks.

R252
Per lead — lead-gen spend only16 leads from R4,037 of dedicated lead-gen budget in the measured flight, against a ~R744 gated median. Form completion ran 46–57% against a 10–13% benchmark.
34
Site conversions — the carousels' job23 of them from the value-proposition carousels alone.
44–48%
Video view rate — the videos' jobAgainst a 29.5% benchmark, 15–19 points over.
R14.79
Blended cost per click, account-wideAgainst a ~R92 B2B market average, across 1.03M impressions.

Reported honestly: no flight ran longer than five weeks against LinkedIn's six to eight week optimisation runway, so these are pre-optimisation numbers. A June conversion tag counting view-throughs is excluded throughout.

Every benchmark, side by side

The account against LinkedIn's own published B2B norms, plus the email programme against standard B2B email benchmarks. One number missed, and it is shown with the rest — a scorecard that only ever shows wins is a brochure.

R218
CPM vs ~R559 norm61% cheaper per thousand impressions.
R44
Flight CPC vs ~R92 norm52% cheaper per click on the measured flight.
R252
CPL vs ~R744 gated medianA third of market — and ~R1,984 is the EMEA norm.
4.6–5.3%
Lead-gen engagement rateAgainst a ~0.5% non-video benchmark — roughly nine times it.
44–48%
Video view rate vs 29.5%15–19 points over the platform norm.
36.7% / 4.1%
Email opens / clicks vs ~30–35% / ~2.5%The onboarding sequence, bot-filtered; the outreach sequence opened at 61.5%.

The miss, reported with the wins: carousel CTR ran 0.32% against a 0.40–0.55% band — the one format below benchmark, which is why the recommendation was to keep carousels on the conversion job they were winning rather than the click job they were losing. And the email programme's zero replies across both sequences is in the next chapter's reflection, because it is the finding that matters most.

And the leads were the right people

The count matters less than who filled the forms in. From the lead-form exports, assessed on work-email capture, seniority and ICP fit:

~25 of 52
Call-first tierWork-email leads at ICP accounts with decision-layer titles — the leads a salesperson actually phones.
91%
Work emails, newest cohortUp from ~27% in the launch era. The refinement is visible in the pipeline itself.
9 of 11
Newest cohort inside the ICPSenior research, strategy and CX roles at exactly the institutions being targeted.

Among them, by role: CX management at Capitec, market research at FNB, business analysis at Old Mutual, a risk and compliance executive at Vodacom Financial Services, business development at Cardinal Insurance Management Systems, the head of marketing at Warwick Wine Estate, the chief executive of Bed King and the product lead at SnapScan. Roles from the lead-form exports; no names published.

What the four months proved

  • Costs beat the market in every era, on both broad and strict decision-maker targeting.
  • Lead generation produced contactable pipeline in every single flight it appeared in.
  • Insight-led messaging won everywhere it ran, in ads and in organic alike.
  • Spend and results moved together: the highest-spend month was also the highest-lead month.
  • Format, not message, decided performance. The same line was the best video and the weakest carousel.

The product: Social Sweep

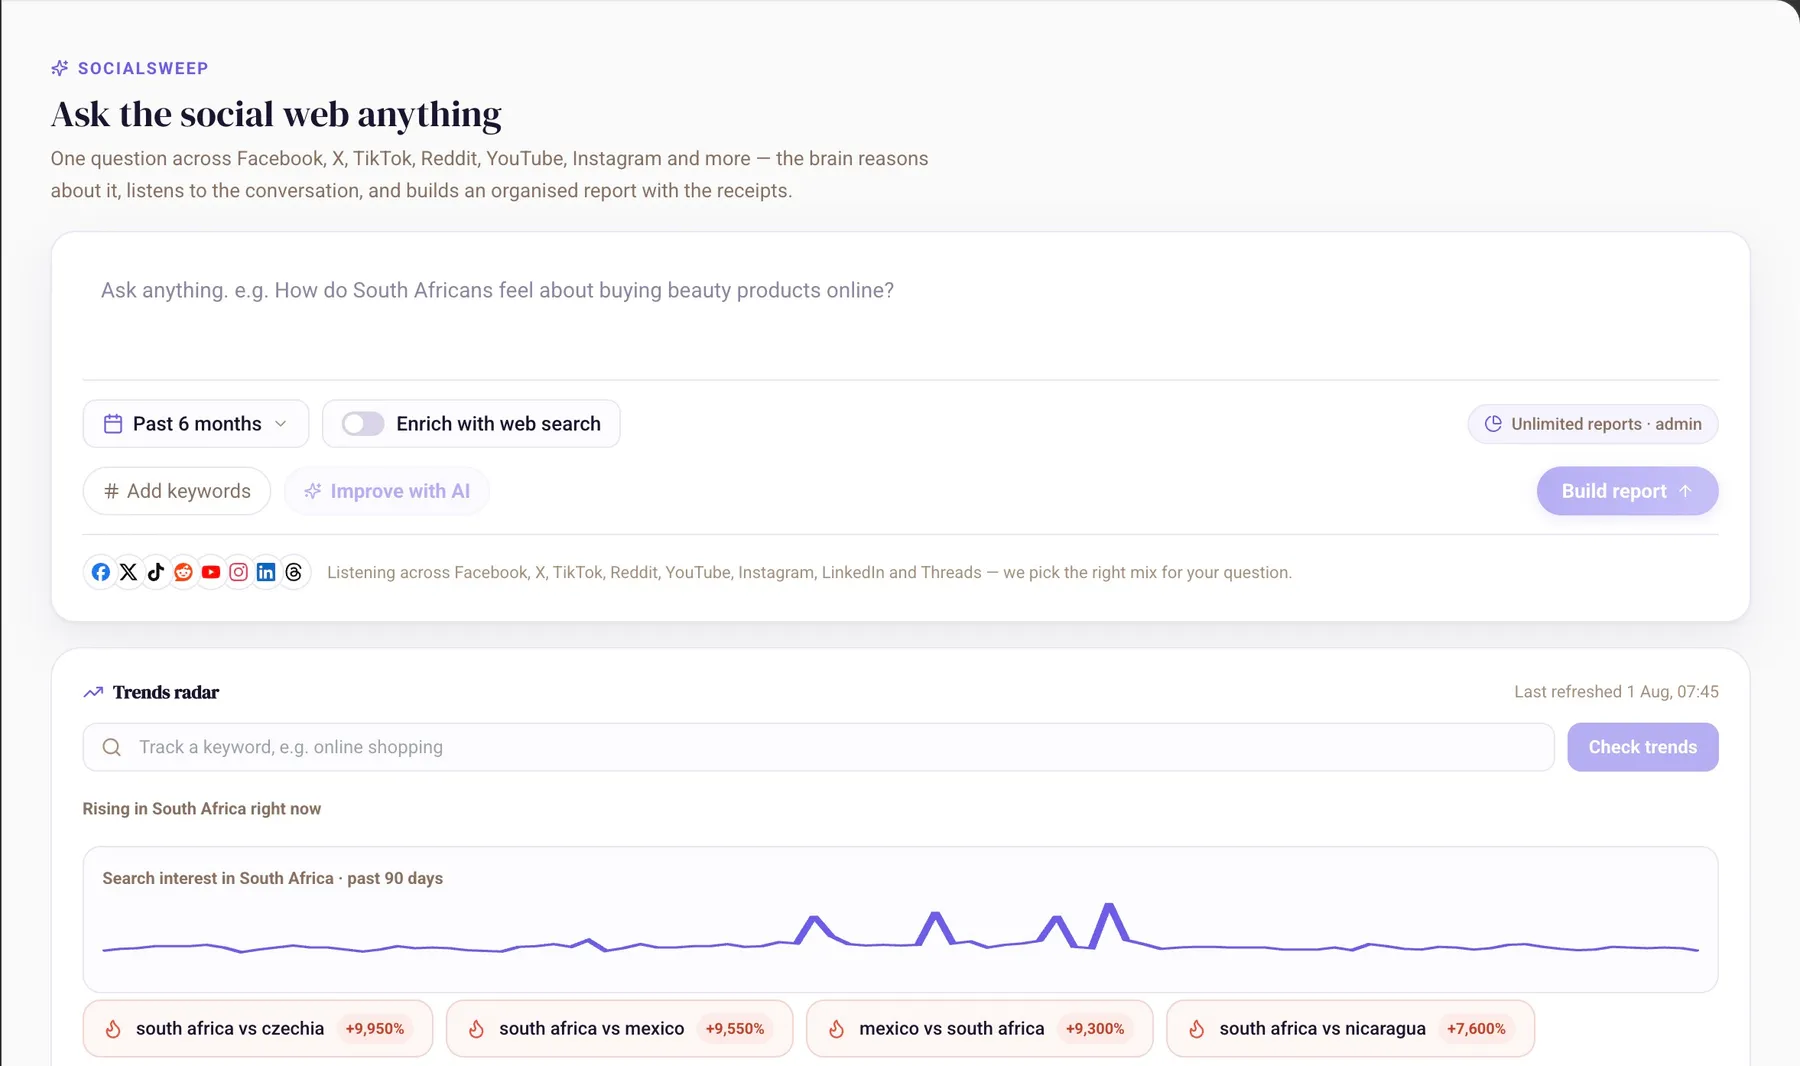
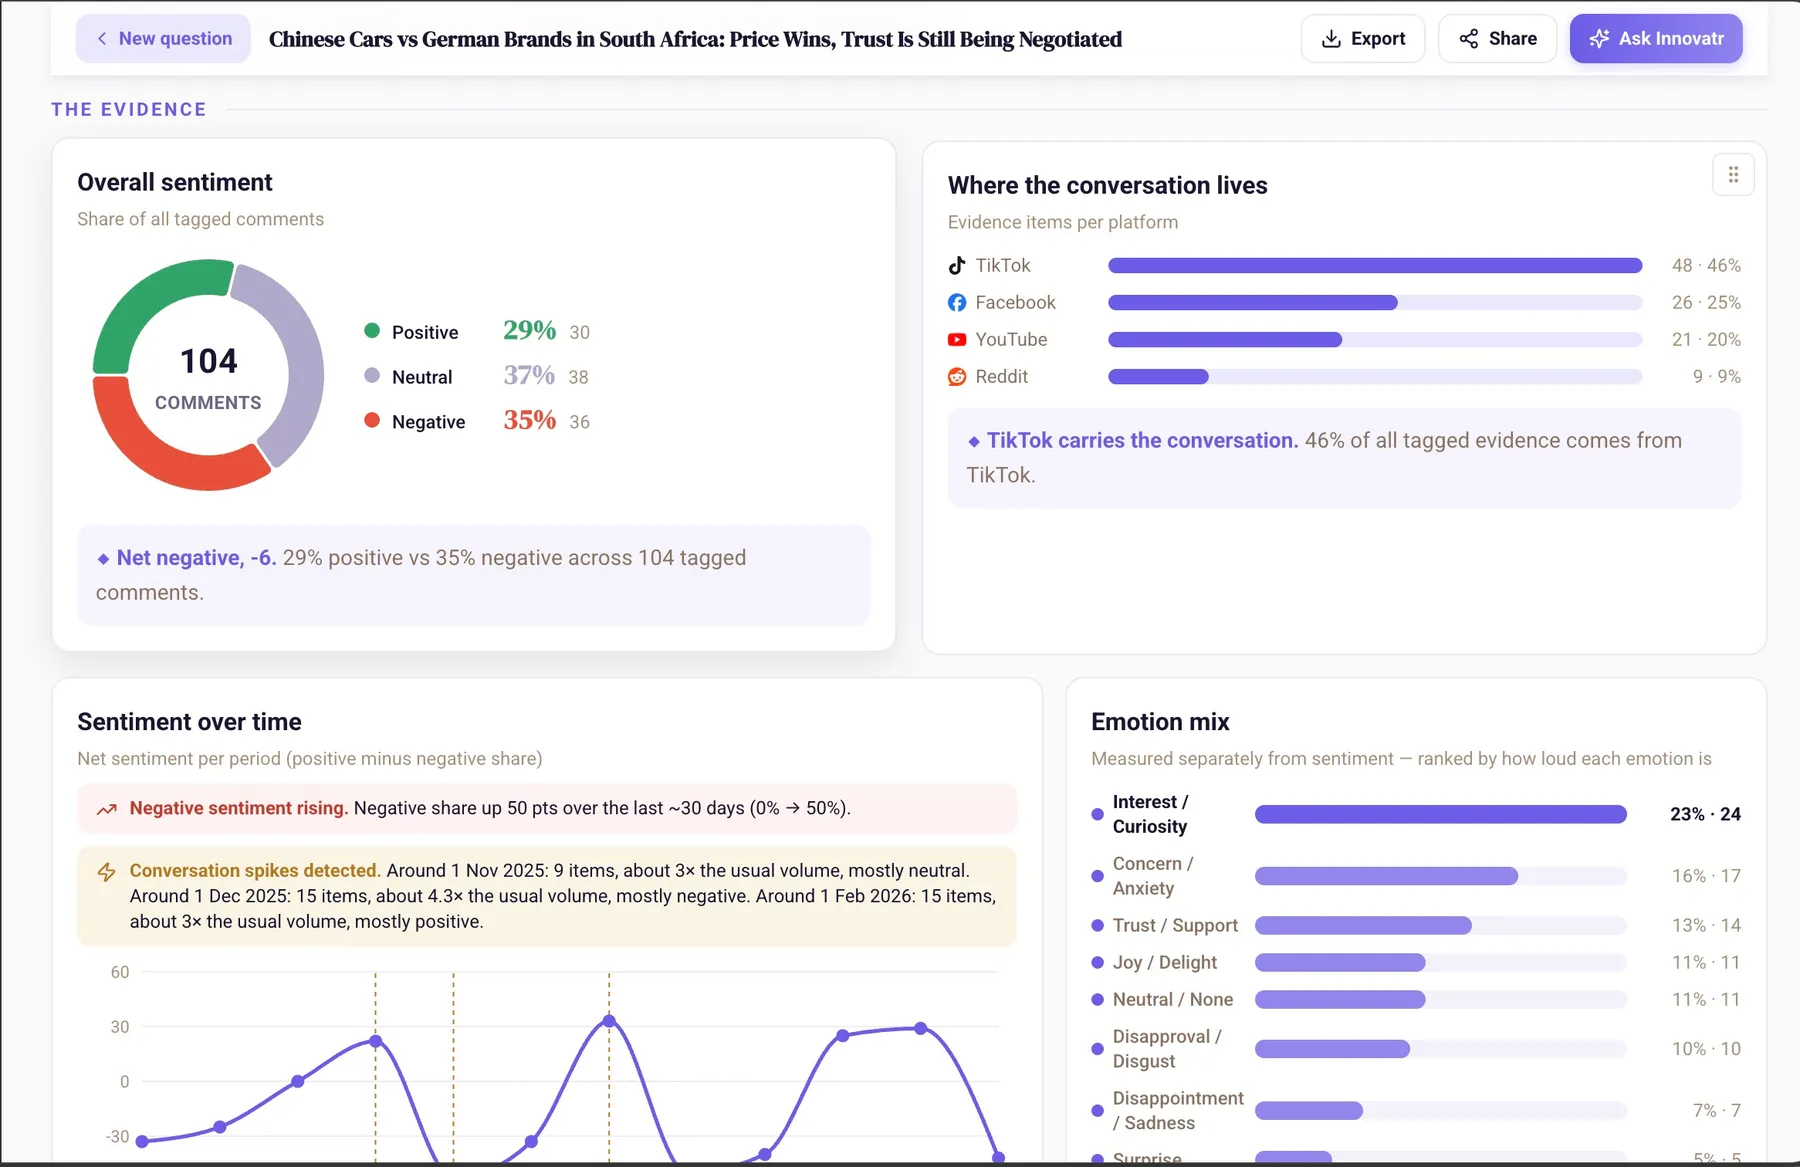
Innovatr was about to licence a social listening platform at US$8,000 a year. I built the capability in-house instead: platform APIs feeding an AI reasoning layer, prototyped in Replit and built out with Claude.

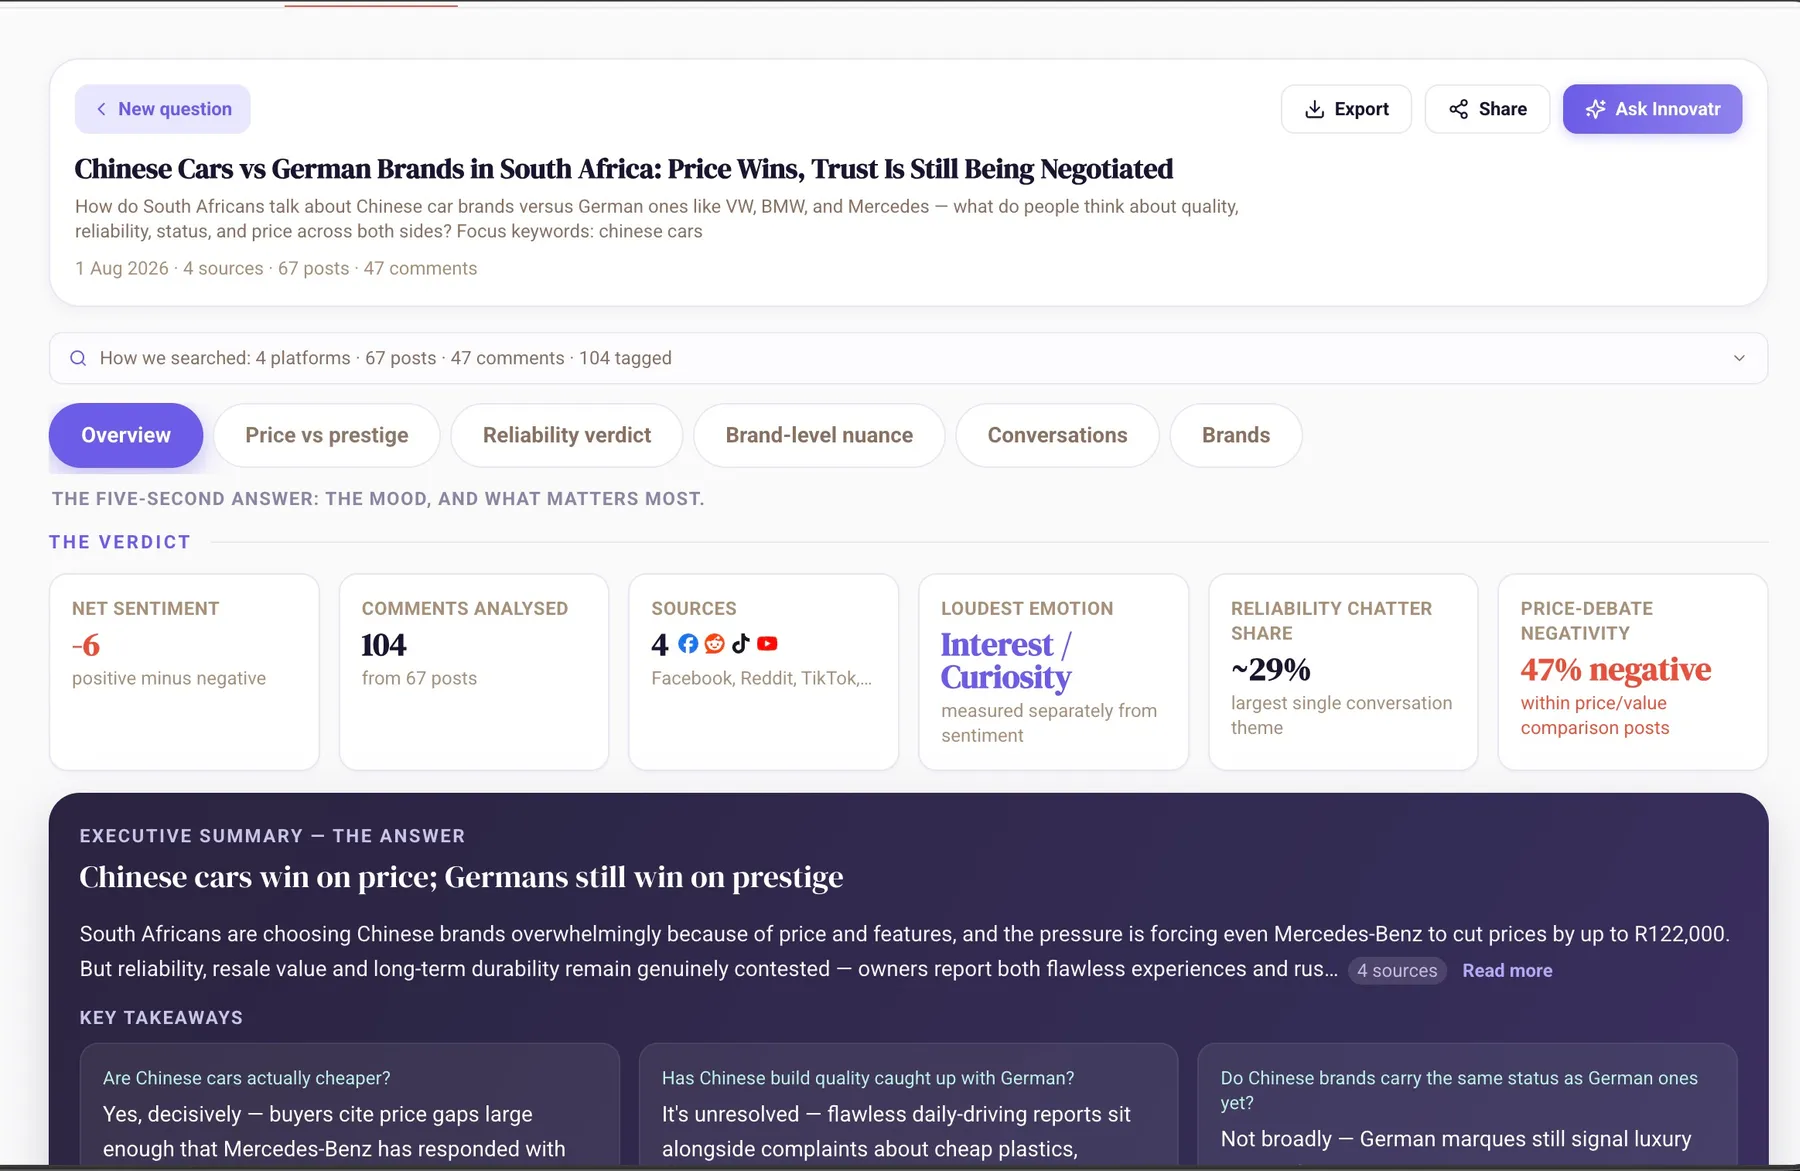
Social Sweep takes a plain-language question — “How do South Africans talk about Chinese car brands versus German ones?” — works out which platforms are worth reading for that particular question, and returns an organised report in which every claim resolves back to a real comment. Net sentiment, emotion mix, where the conversation actually lives, what is spiking, and the quotes underneath all of it. It runs on the Social Crawl API, so the reachable surface is 46 platforms across social, search, commerce and the open web.

That turned a line of annual cost into a line of product. The same engine Innovatr would have rented became something it could sell, positioned at R20,000 a study.

What building it instead of buying it was worth

US$8,000/yr
Licence cost replacedThe quoted annual price of the third-party tool it stood in for.
R20,000
Priced per studyPositioned as a billable Innovatr product, not internal tooling.
46
Platforms reachableThrough the Social Crawl API it runs on: social, search, commerce and the open web.

R20,000 is the price the product was positioned at, not revenue booked. The licence figure is the quote Innovatr was working from at the time. Platform count is Social Crawl's current published coverage, 46 platforms across 368 endpoints; Social Sweep selects the right subset per question rather than querying all of them.

Inside the tool

What I'd do differently

Start the call motion sooner. The nurture data said it plainly: the email sequences earned 36–62% open rates against a ~30% benchmark and produced zero replies — opens prove interest, and the absence of replies proves email alone cannot convert it. Warm leads sat unworked while the machine that found them kept improving. If I ran it again, a human follow-up call within 48 hours would exist from the first lead, not as a recommendation in the final report.