Thrifty Adventures

Lead forms converting at three times the LinkedIn norm and 3.1 million organic views on TikTok, for a travel brand taken from scattered to deliberate across four channels. TikTok and Instagram were grown on what was already there; LinkedIn and search were built from nothing.
Thrifty Adventures runs group and tailored tours out of South Africa. Contracted as digital marketing manager to lift return on ad spend, open new audiences on channels like LinkedIn, and turn attention into leads. Social and TikTok were already running; paid was not. I gave each channel one job.
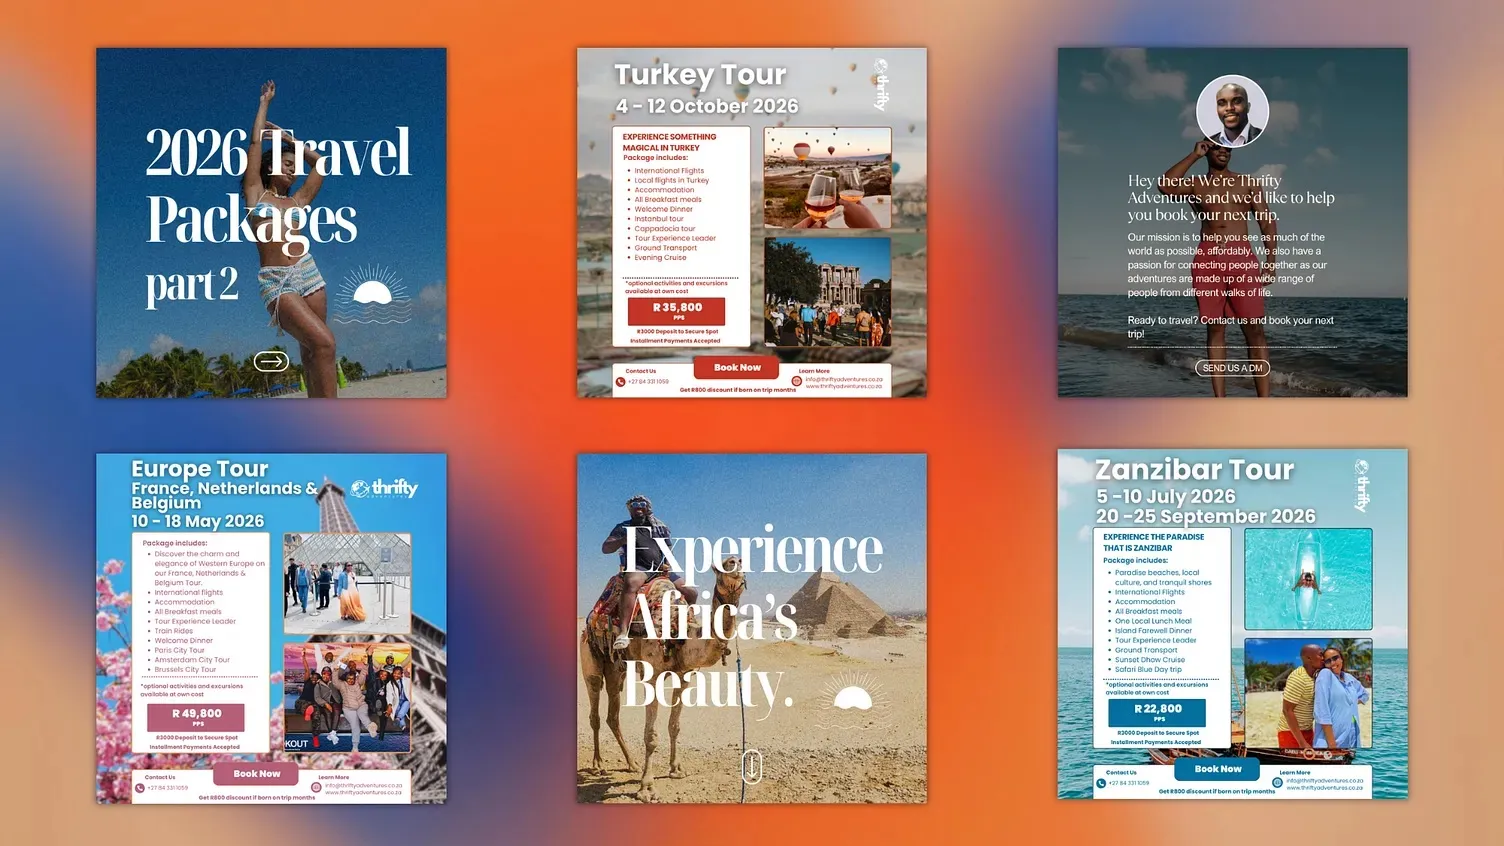
The channel nobody picks for travel
The brand already had a social presence. What it did not have was paid: no campaigns, no tracking, no idea what a click was worth. TikTok and Instagram needed sharpening. LinkedIn needed inventing.
LinkedIn is where you go to reach a job title, and this sells group tours to people spending their own money. On paper it is the wrong platform. Seven months of sustained spend says it works, but not for the reason I expected.
Reach up 47×, and the price down every month
July started small, at the price a new account always pays. September ran four objectives side by side, which is the only way to learn what a platform charges for each thing it sells. Then: drop what it killed, fund what survived.
| Month | Reach, indexed to July | What changed |
|---|---|---|
| Jul 2025 | 1× | The baseline. A new account pays the most it will ever pay. |
| Aug 2025 | 8× | Clicks 58% cheaper than July. |
| Sep 2025 | 23× | Four objectives tested. The first wave of leads. |
| Oct 2025 | 22× | Conversions and video in. |
| Nov 2025 | 20× | Cut back to the winners. |
| Dec 2025 | 48× | Scaled. CPM down 73% from July. |
| Jan 2026 | 47× | Cheapest month: clicks 70% cheaper than July, CPM down 81%. |
Reach is indexed to the first month rather than reported raw; impression counts and spend stay with the client. CPM fell 81% across the run and cost per landing page click fell 70%. Some of that is an account earning its own history.
The brochure was the whole finding
Targeting did not decide this. Same audience, same platform, same form. One version asked people to enquire about a trip; the other offered the 2026 brochure. Only one asked for something the reader already wanted.
- 36.6%
- Form completion, brochureAgainst 8.6% on the identical form with nothing to collect at the end.
- 10–15%
- The LinkedIn normThe brochure beat the band by more than the rest of the account missed it.
- 73%
- Of all leads came from the brochure askThe stronger offer carried the account.
- +39%
- Cost per lead, everything elseThe weaker ask cost two-fifths more per lead. Absolute costs stay with the client.
Same platform, market, months and form. The only variable was what the ad asked for, which is the cheapest thing on this page to copy, and the one that moved the most.
What seven months bought
From no paid presence on the channel at all.
- 0.97%
- Click-through vs 0.52% medianNearly double the median across 150,000+ LinkedIn campaigns.
- 70%
- Cheaper clicks by the endWhat a landing page click cost in month seven versus month one.
- 81%
- CPM fall across the runWhat a thousand impressions cost in month seven versus month one.
- 16
- Campaigns across six objectivesSeven months, one channel, every rand tracked. Budget, lead counts and unit costs stay with the client.
Clicks are landing page clicks, not LinkedIn's headline Clicks column, which also counts reactions and follows. The 0.52% median is AgencyAnalytics, January 2025. Spend totals, lead counts and unit costs are the client's and are held back.
3.1 million views, and 38% of them from search
TikTok already had an audience. The work was making it findable: destinations shot plainly, captioned as questions people actually type. The search share is what matters commercially, because it means the back catalogue keeps earning after a post stops trending.
- 38.1%
- Of views came from searchPeople looking for a destination and finding Thrifty, rather than being served it.
- 3.1M
- Views, organicJun 2025 to Jan 2026, reaching 3.3M people who had never seen the brand.
- 7,200
- SharesThe signal that matters most on the platform: someone sending it to a person.
Period figures for Jun 2025 to Jan 2026. The account had a following before this work and the starting number was not recorded, so no growth is claimed. For You typically carries around 70% of views; here it is 57.6%.
And then paid, to start conversations
One destination, one video, one objective: get a person into a message thread. A week of delivery, priced per conversation started.
- Cheapest
- Qualified contact in the accountWeighted across all nine videos, not the best one quoted as if it were typical. Costs and volumes stay with the client.
- 9
- Destination videos in one week's testEach priced per conversation started, so the winners were provable in days.
- 43%
- Of conversations from the best videoBali and Thailand, at essentially the account average per conversation.
TikTok's own figures for 30 Jan – 6 Feb 2026, reported as the week they cover. “Conversations” is TikTok's metric for a messaging thread opened off an ad. How many became bookings is unknown; that attribution was never wired up.
Search, for the people already looking
The cheapest job on the list, and the one with the least argument attached: someone typing the name of a tour is not a person to be persuaded.
- ~99%
- Below the travel median cost per clickAgainst the $2.14 median in the 2026 benchmark set. The absolute cost stays with the client.
- 8.04%
- Account click-through rateAgainst a 9.32% search median. The display campaign carried 18.12% on its own.
- 6
- Campaigns, Jun 2025 to Feb 2026Search, display and Performance Max, each on its own job. Click and impression volumes stay with the client.
Benchmark: WordStream's 2026 study of 13,474 US search campaigns. Two caveats: most of this volume is display and Performance Max, where clicks are cheaper by design, and US inventory is far more contested than South African, so part of the gap is the market rather than the management.
What each channel was actually for
The point of running four is not four times the volume. It is that a holiday is not bought in one motion, and the channels are good at different parts of it.
- TikTok organic gets the brand found, and keeps working months later.
- TikTok ads turn that into a conversation: the cheapest qualified contact in the account.
- Google catches people already pricing a trip. Cheapest clicks, least persuasion.
- LinkedIn sells the considered trip: the account's costliest contact, and its most considered.
- None was asked to do another's job. The brochure that made LinkedIn work would have died on TikTok, and the destination video that pulls conversations on TikTok drew 0.10% click-through as a LinkedIn ad.
What didn't work
Brand awareness bought the most expensive clicks on the platform, over ten times the cheapest month's. Single-destination videos did not travel either. The one composite edit, a year of trips in a single video, out-pulled all of them at a fraction of the cost: people responded to the range, not one place.
The conversion columns on both platforms are unusable: more recorded conversions than clicks, and a 232% conversion rate on one campaign, from broad tags firing on ordinary page loads. So no conversion figure appears anywhere on this page.